


公式サプライヤー
公式および認定ディストリビューターとして200社以上の開発元から正規ライセンスを直接ご提供いたします。
当社のすべてのブランドをご覧ください。
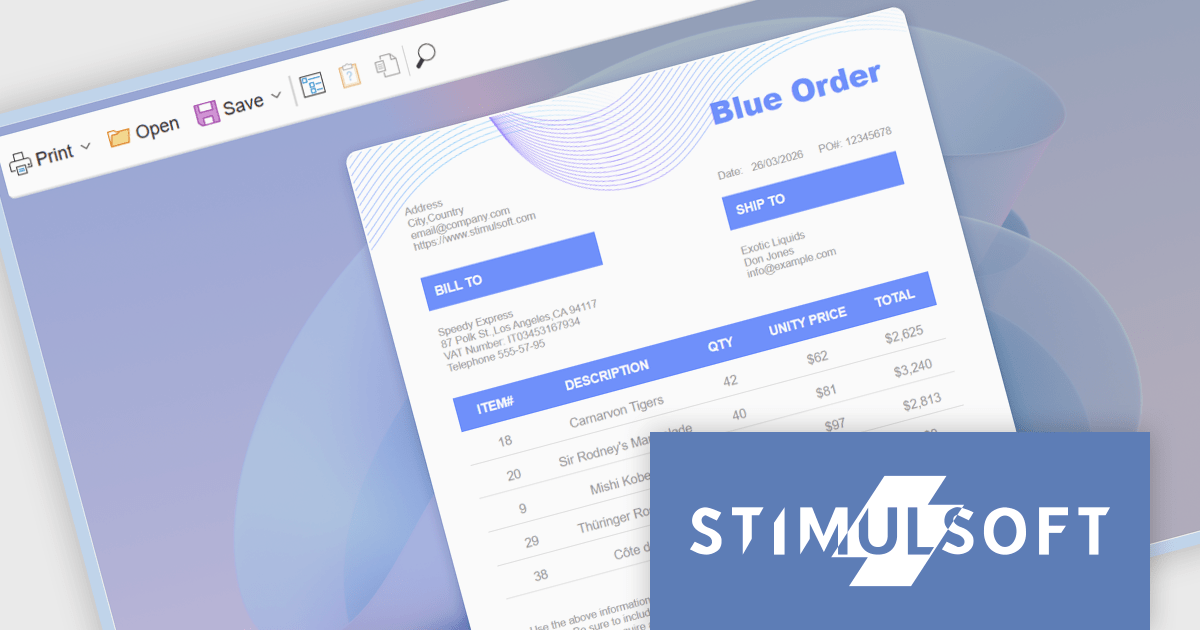
Stimulsoft Reports.WEB is a cross-platform reporting solution designed for integration within web applications. It leverages a client-server architecture for report generation, viewing, printing, and exporting directly in web browsers. Its powerful .NET report engine offers efficient report processing, a user-friendly HTML5 report designer for building reports with various data sources and visualizations, and an interactive HTML5 viewer for seamless report display within web applications. This integration allows developers to implement robust reporting functionalities without browser plugins or additional client-side dependencies.
The Stimulsoft Reports.WEB 2026.2 update introduces a native React Viewer component that allows developers to embed report viewing and interaction directly within React applications using standard npm and NuGet packages. This approach simplifies integration and deployment by aligning with familiar tooling and workflows, while the clear separation between client-side and server-side components supports scalable architecture and easier maintenance. It also enhances performance through efficient client-side rendering and provides a consistent way to deliver interactive reporting functionality within modern web development environments.
To see a full list of what's new in 2026.2, see our release notes.
Stimulsoft Reports.WEB is licensed per developer and is available as a perpetual license with 1 year support and maintenance. See our Stimulsoft Reports.WEB licensing page for full details.
Stimulsoft Reports.WEB is available individually or as part of Stimulsoft Ultimate.
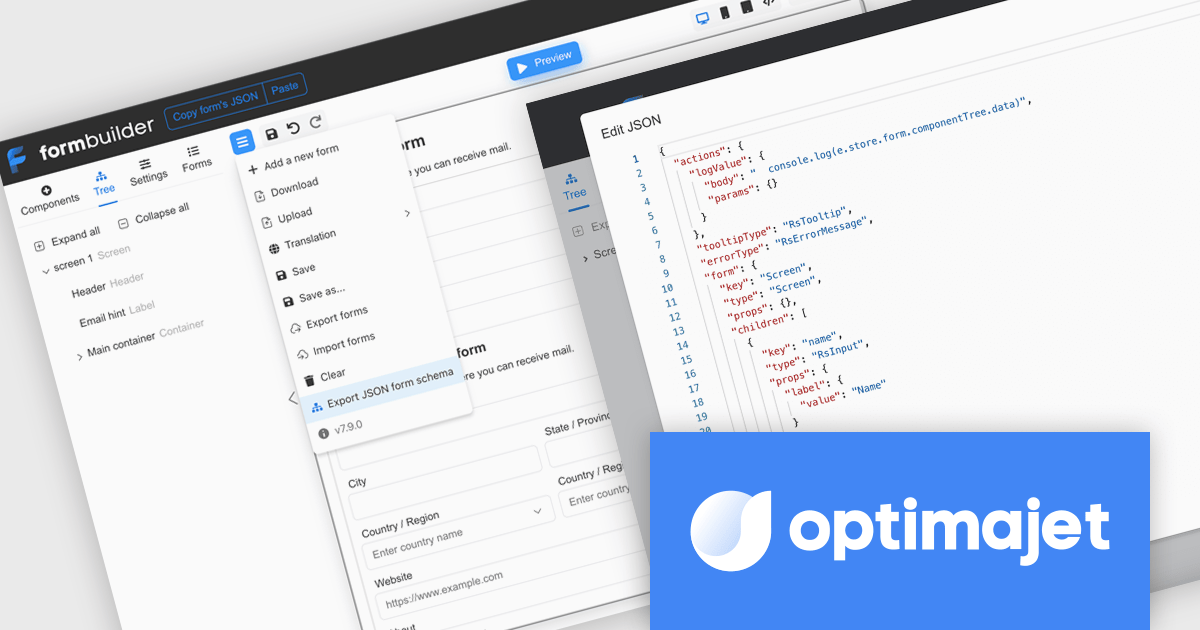
Optimajet FormEngine is a drag-and-drop React form builder that lets teams create, manage, and render complex web forms without writing frontend code. It allows developers and business users to visually design forms, store them as JSON, and render them at runtime. As a React JS library, it easily integrates into existing applications while giving developers full control over form logic, structure, and data flow, making it well suited for complex data collection.
Optimajet FormEngine enables JSON Schema validation for forms, allowing developers to validate form JSON directly within their IDE, identify structural issues, incorrect data types, and unsupported configurations early in the development process, and enforce a consistent, well-defined structure across all forms. By providing real-time feedback, inline error highlighting, and autocomplete suggestions, it improves accuracy and reduces the need for repeated testing cycles, helping developers work more efficiently while minimizing runtime errors and ensuring more reliable form implementations.
Optimajet FormEngine is licensed based on usage type (internal commercial use, public web/SaaS, or OEM embedding), number of domains for the visual editor, and access to additional ready-made components. Licenses are perpetual and include 6 months or 1 year of updates and support. See our Optimajet FormEngine licensing page for full details.
For more information, visit our Optimajet FormEngine product page.
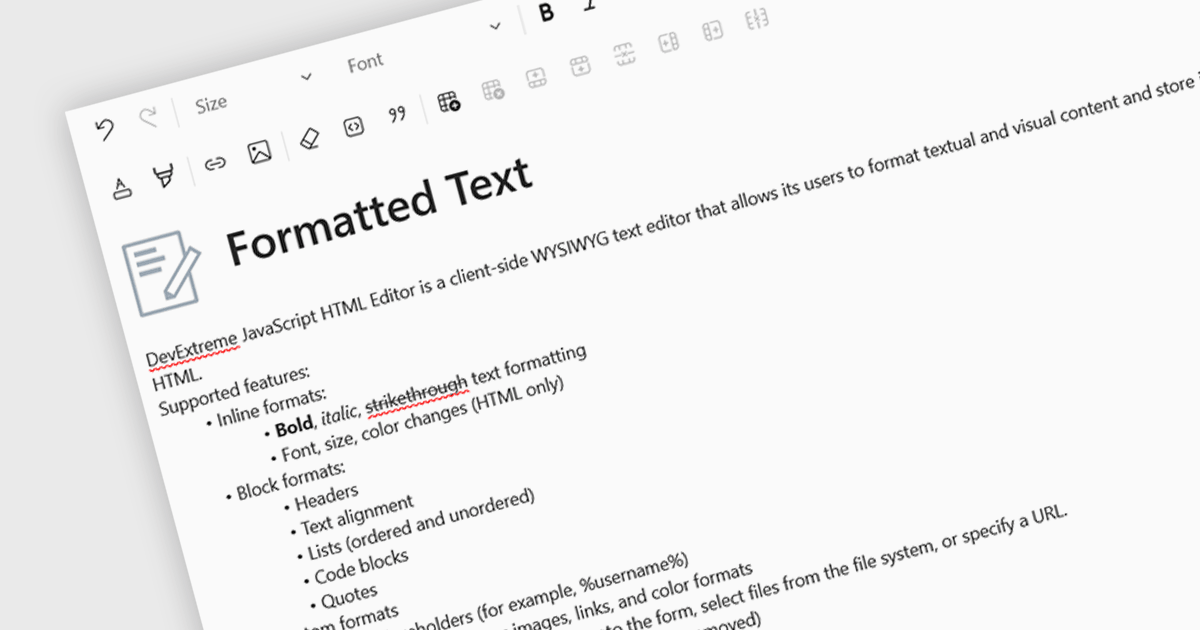
An RTF (Rich Text Format) editor allows users to create and modify formatted text, such as bold, italics, fonts, colors, and embedded elements. This capability is particularly useful in applications where descriptive or user-generated content must retain presentation alongside data, such as CMS platforms, reporting tools, or enterprise data grids. By integrating rich text editing at the component level, it enables more expressive data entry, reduces the need for external editors, and ensures formatting consistency when storing and rendering content across systems.
Several React data editor collections include RTF (rich text format) functionality, including:
For an in-depth analysis of features and price, visit our comparison of React data editors.

Gauge charts are data visualizations that display a single value within a defined range, making it easy to understand status or progress at a glance. Often styled like a speedometer, they show where a value sits between minimum and maximum thresholds, using color to indicate different levels. This provides clear, immediate insight without detailed analysis. Key benefits include quick understanding, intuitive design, and strong visual emphasis on limits or targets. Gauge charts are commonly used in dashboards to track KPIs, monitor targets, show completion percentages, or highlight key metrics in a simple and effective way.
Several React charting components also offer gauges, including:
For an in-depth analysis of features and price, visit our comparison of React chart components.

Sencha Ext JS is an enterprise-focused JavaScript framework for building complex, data-intensive web applications, particularly business software such as dashboards, admin systems, reporting tools, and other large-scale user interfaces. It provides a broad library of prebuilt components, including grids, charts, forms, layouts, and data handling features, along with supporting tools for theming, testing, and application development, which helps teams create consistent, cross-platform applications more efficiently. In practice, Ext JS is best known for its strong support for rich user interfaces and large datasets, making it a good fit for organisations that need robust, maintainable front-end applications rather than lightweight websites.
The Sencha Ext JS v8.0 update adds QR Code Reader/Generator functionality that lets developers generate and read QR codes directly within applications across both the Modern and Classic toolkits. It supports use cases such as payments, data sharing, contact exchange, calendar events, geolocation, phone and SMS, email, and Wi-Fi configurations, while also providing rendering options including SVG, Canvas, and PNG, plus image download, clipboard copy, preview, responsive sizing, customization, and input sanitization. The result is a built-in way to add QR code barcode capabilities to enterprise applications with broad format support and flexible configuration.
To see a full list of what's new in v8.0, see our release notes.
Sencha Ext JS is available in Pro, Enterprise and Ultimate editions, as Annual Subscription Licenses. See our Sencha Ext JS licensing page for full details.
For more information, see our Sencha Ext JS product page.
電話: (888) 850 9911
Fax: +1 770 250 6199


