


公式サプライヤー
公式および認定ディストリビューターとして200社以上の開発元から正規ライセンスを直接ご提供いたします。
当社のすべてのブランドをご覧ください。
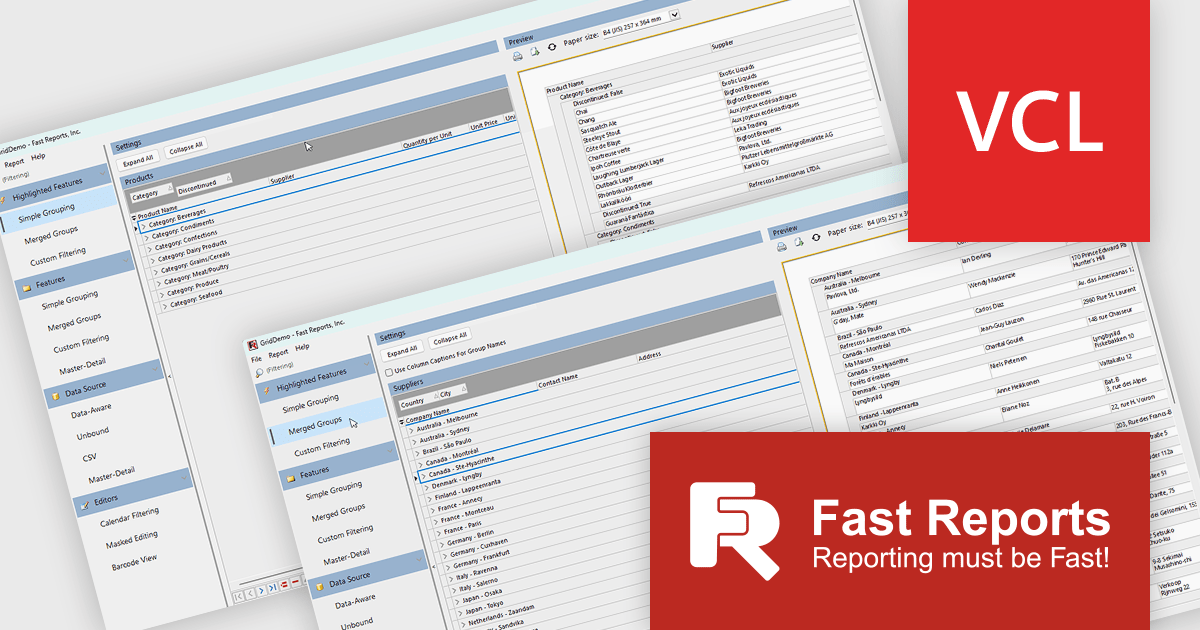
FastGrid is a modern, high-performance grid component designed for VCL and Lazarus environments, now incorporated into the FastReport VCL Ultimate package. It provides developers with an efficient and intuitive way to present, explore, and interact with data using minimal code. By supporting the standard TDataSource interface, FastGrid works easily with a wide range of database access technologies, including FireDAC, ADO, BDE, IBX, Oracle, and more, making it a versatile solution for data-driven applications. Its full compatibility with FastReport VCL also allows users to print and export while retaining all sorting, filtering, and visual settings.
The new FastGrid release introduces nested grouping with expand and collapse functionality, enabling developers to organize complex datasets into structured, multi-level hierarchies within grids. This enhancement improves data clarity by allowing users to control how much information is visible at any time, making it easier to navigate between high level summaries and detailed records. It also supports more efficient data analysis and interaction by providing a more intuitive way to explore relationships within the data, while maintaining a consistent and flexible editing experience across different field types.
FastGrid is included in FastReport VCL Ultimate which is licensed per named user and is available as a Perpetual license with 1 year of technical support and product updates. See our FastReport VCL Ultimate licensing page for full details.
Learn more on our FastReport VCL Ultimate product page.

Highcharts Grid Pro is a versatile data grid component developed by the creators of Highcharts, offering both standalone functionality and tight integration within the Highcharts and Highcharts Dashboards ecosystems. It features advanced capabilities such as real-time data binding, column sorting, filtering, inline editing, pagination, and data export, enabling users to work with structured data efficiently. Features include:
Highcharts Grid Pro is licensed per developer as an Annual or Perpetual License with Internal, Saas, SaaS+ and OEM distribution options. The annual license includes support and all product updates for 1 year and must be renewed to continue to use the software. The perpetual license includes an "Advantage Subscription" which provides support and updates for a set period of time. If you do not renew Advantage then you may continue to use the software at the last release available during the active Advantage period. See our Highcharts Grid Pro licensing page for full details.
Learn more on our Highcharts Grid Pro product page.
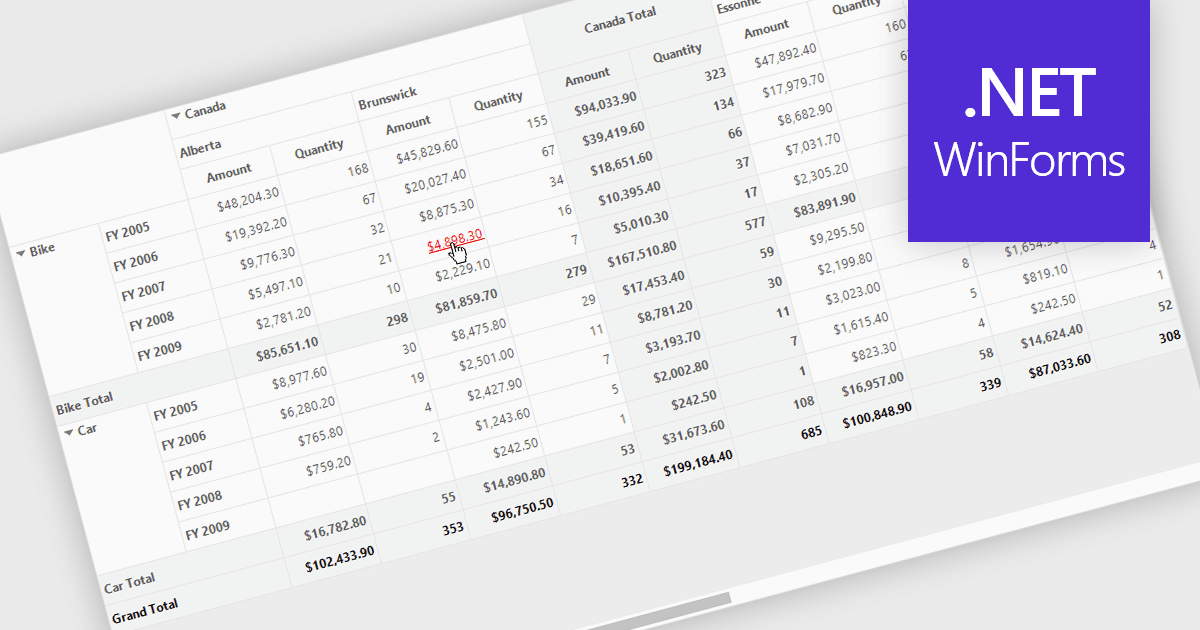
Hyperlinks in grids allow individual cells to function as clickable links, enabling users to navigate directly to related records, pages, or external resources. This makes data more interactive and improves usability by reducing manual searching. Users can quickly access additional context such as detailed views, reports, or linked systems without leaving the grid. Common use cases include linking customer names to profiles, order IDs to transaction details, or connecting data to external documentation, helping improve productivity and efficiency.
Several .NET WinForms grid controls offer hyperlink cell types, including:
For an in-depth analysis of features and price, visit our .NET WinForms grid controls comparison.
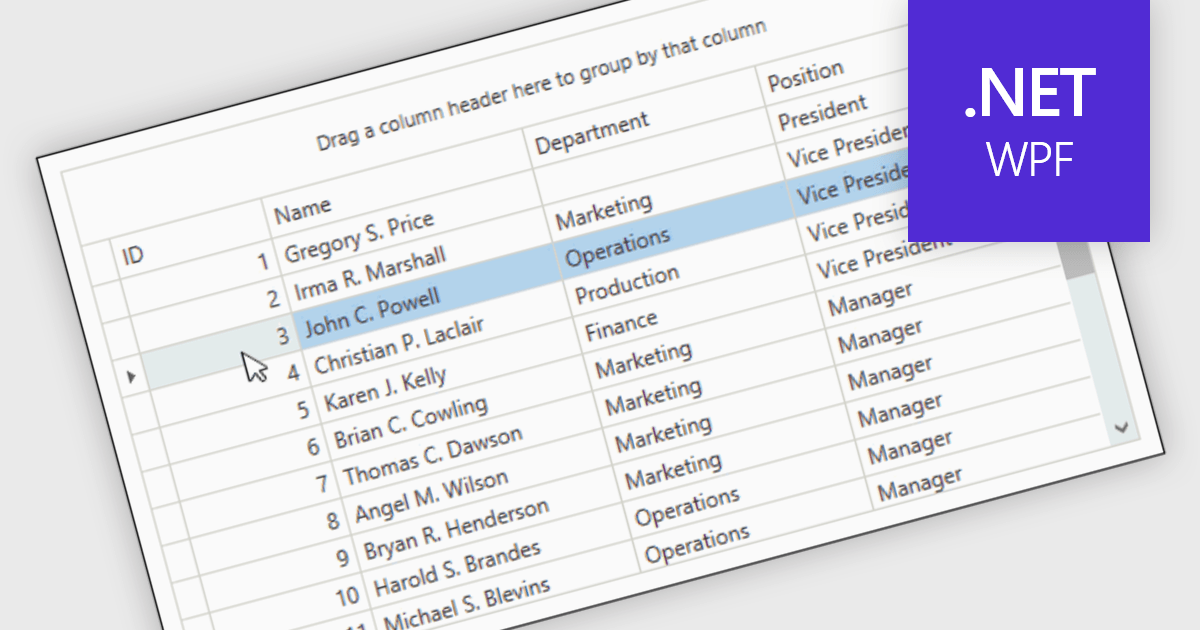
Reorder Rows is a WPF grid feature that lets users move a row by changing its display order directly in the control, usually through drag-and-drop, so data can be arranged in a meaningful custom sequence. For .NET developers, it is useful when row position represents business intent, such as task priority, processing order, or a user-defined layout, because it supports direct interaction while reducing the need for separate ordering controls or additional code for manual sequencing.
Many .NET WPF grid controls contain reorder row functionality including:
For an in-depth analysis of features and price, visit our comparison of .NET WPF grid controls.
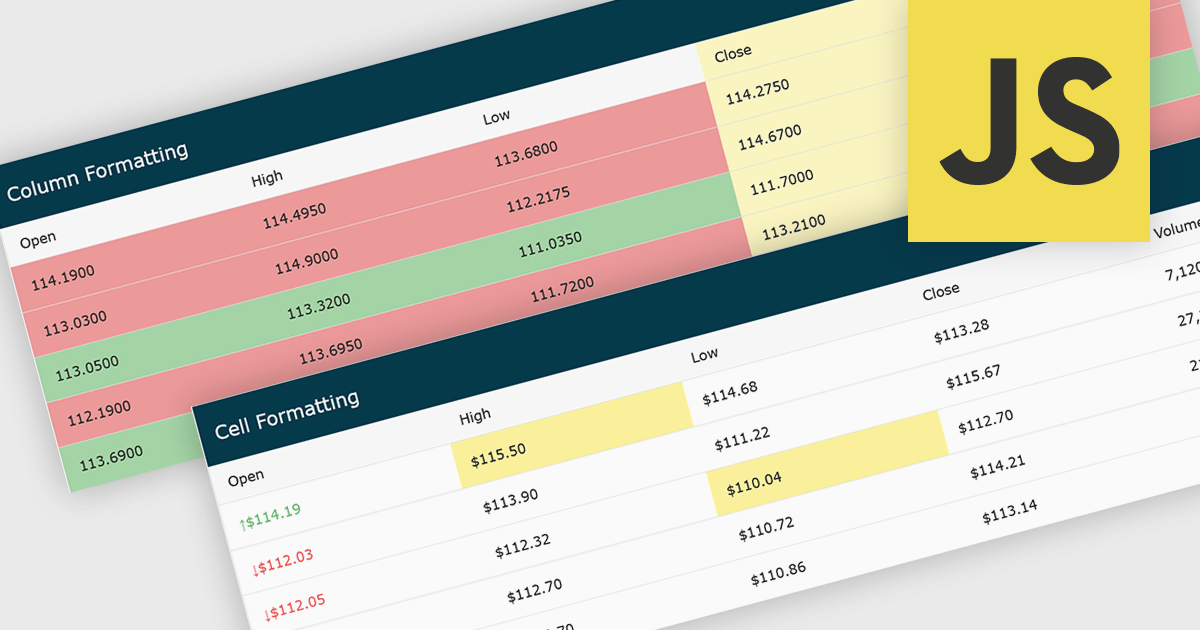
Conditional formatting in grids automatically applies visual styles such as colors or icons based on defined rules, making it easier to interpret large datasets at a glance. It improves readability, highlights patterns and outliers, and supports faster, more informed decision making by surfacing key insights in real time. Common use cases include flagging budget issues in financial reports, emphasizing top performing sales data, monitoring KPIs, and drawing attention to errors or critical statuses in operational tools.
Several JavaScript grid controls offer conditional formatting, including:
For an in-depth analysis of features and price, visit our comparison of JavaScript Grid controls.
電話: (888) 850 9911
Fax: +1 770 250 6199


