


公式サプライヤー
公式および認定ディストリビューターとして200社以上の開発元から正規ライセンスを直接ご提供いたします。
当社のすべてのブランドをご覧ください。
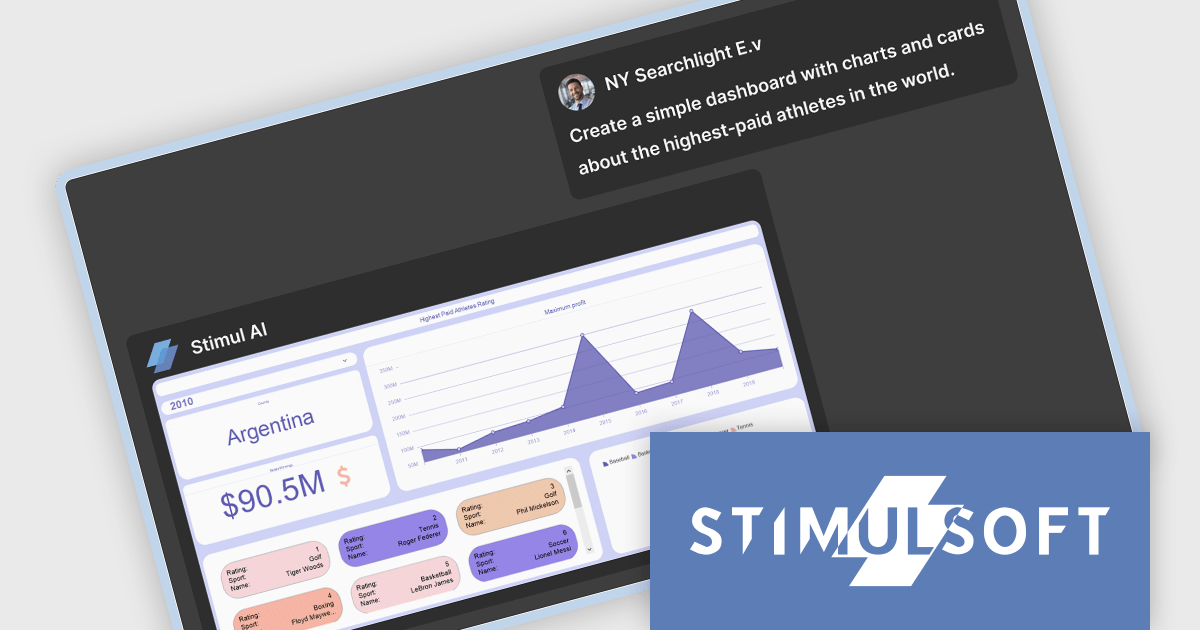
Stimulsoft BI Designer is a powerful reporting tool designed to create visually appealing and interactive reports. It allows users to design and develop complex reports with ease, integrating data from various sources and presenting it in a clear, concise, and informative manner. With its rich feature set, Stimulsoft BI Designer is widely used in diverse industries, including finance, healthcare, retail, and manufacturing, to generate reports for analysis, decision-making, and compliance purposes. Key benefits include its intuitive interface, extensive customization options, and support for multiple data sources, making it an essential tool for organizations seeking to enhance their reporting capabilities and gain valuable insights.
The Stimulsoft BI Designer 2026.2.1 update introduces an AI assistant for dashboard creation that enables developers to generate fully functional dashboards from text prompts. By supporting both new and existing data sources and handling everything from simple to complex dashboard structures, it improves implementation while maintaining flexibility. The ability to apply styles on demand further enhances efficiency, allowing developers to focus on data logic and application integration rather than UI configuration.
To see a full list of what's new in 2026.2.1, see our release notes.
Stimulsoft BI Designer is available as a perpetual license and is licensed per creator. A creator is a person who creates reports, dashboards, or forms in a standalone (desktop) designer or online designer. The creator may install one copy of the standalone (desktop) designer. See our Stimulsoft BI Designer licensing page for full details.
Stimulsoft BI Designer is available individually or as part of Stimulsoft Ultimate.
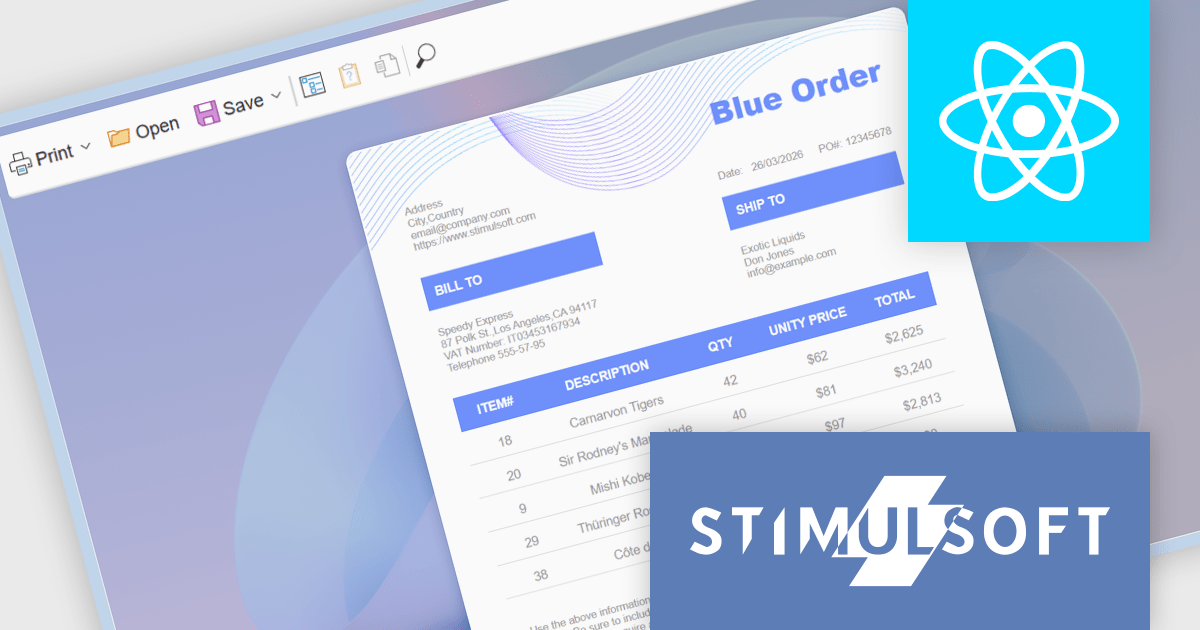
Stimulsoft Reports.WEB is a cross-platform reporting solution designed for integration within web applications. It leverages a client-server architecture for report generation, viewing, printing, and exporting directly in web browsers. Its powerful .NET report engine offers efficient report processing, a user-friendly HTML5 report designer for building reports with various data sources and visualizations, and an interactive HTML5 viewer for seamless report display within web applications. This integration allows developers to implement robust reporting functionalities without browser plugins or additional client-side dependencies.
The Stimulsoft Reports.WEB 2026.2 update introduces a native React Viewer component that allows developers to embed report viewing and interaction directly within React applications using standard npm and NuGet packages. This approach simplifies integration and deployment by aligning with familiar tooling and workflows, while the clear separation between client-side and server-side components supports scalable architecture and easier maintenance. It also enhances performance through efficient client-side rendering and provides a consistent way to deliver interactive reporting functionality within modern web development environments.
To see a full list of what's new in 2026.2, see our release notes.
Stimulsoft Reports.WEB is licensed per developer and is available as a perpetual license with 1 year support and maintenance. See our Stimulsoft Reports.WEB licensing page for full details.
Stimulsoft Reports.WEB is available individually or as part of Stimulsoft Ultimate.
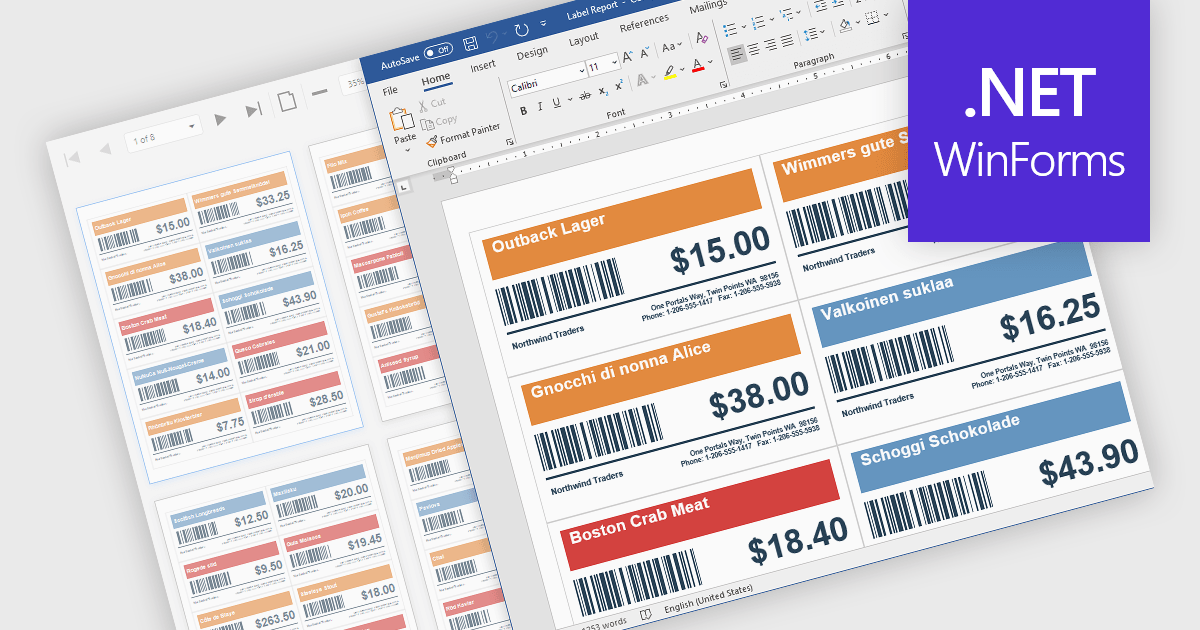
Barcodes in reports involve adding machine readable codes, such as QR codes or linear barcodes, into printed or digital reports to enable quick scanning and automated data capture. This improves accuracy by reducing manual entry, increases efficiency through faster access to information, and supports integration with systems like inventory, CRM, or ERP platforms. It also enhances traceability for tracking items, documents, or transactions. Common use cases include inventory management, order processing, healthcare records, and invoice or ticket verification where speed and reliability are essential.
Several .NET WinForms Reporting controls include Barcodes including:
For an in-depth analysis of features and price, visit our comparison of .NET WinForms Reporting Controls.
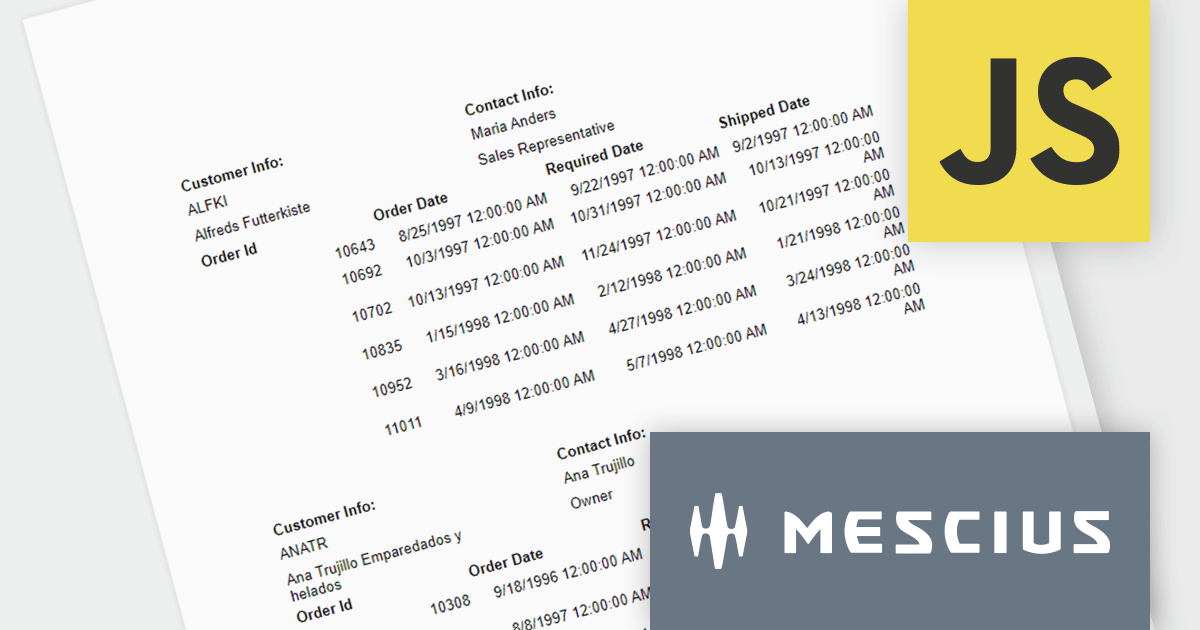
ActiveReportsJS is a powerful, lightweight reporting tool designed to integrate advanced reporting capabilities into any JavaScript application. ActiveReportsJS enables developers to create, view, export, and print richly formatted reports entirely on the client side - with zero server dependencies.
In this blog post, MESCIUS Product Consultant Victor Stahlman demonstrates how to build nested data regions in ActiveReportsJS to create master-detail reports that display related data, such as customers and their orders, within a structured layout. He walks your through configuring datasets, nesting controls like Lists and Tables, and applying filters to correctly link and present hierarchical data relationships in your reports. Key topics include:
By implementing nested data regions in ActiveReportsJS, you can transform flat datasets into structured, master-detail reports that are easier to read and analyze.
Read the complete blog to get started building scalable, dynamic JavaScript reports that deliver more meaningful insights to your users.
ActiveReportsJS is licensed on an annual subscription or perpetual basis and is available as a Single Deployment License for non-commercial use, and as a Single Domain License or Unlimited Domain License for commercial and/or SaaS use. See our ActiveReportsJS licensing page for full details.
For more information, visit our ActiveReportsJS product page.
FastReport .NET Ultimate is a comprehensive reporting solution for developers working within the Microsoft .NET ecosystem. It supports the creation, design, and delivery of rich, interactive reports across Windows Forms, ASP.NET, MVC, and .NET Core applications. The Ultimate edition includes server deployment capabilities and extensive export options, such as PDF, Excel, Word, and HTML. It connects to various data sources, including SQL databases and business objects, providing flexibility for enterprise-level reporting. With the integrated FastReport Online Designer, users can edit reports directly in their browsers, enabling efficient collaboration and modern, full-featured report design across both desktop and web platforms.
The latest FastReport .NET Ultimate update introduces support for Google Sheets as a data source, allowing reports to connect directly to cloud-based spreadsheets. It enables developers and data professionals to work with up-to-date information without manual data transfers, making it easier to incorporate shared or frequently updated datasets into reports. It simplifies access to external data while maintaining the familiar reporting experience, making it particularly useful for teams already relying on Google Sheets for data management.
FastReport .NET Ultimate is licensed per named user and is available as a perpetual license with a one-year subscription for updates and support. See our FastReport .NET Ultimate licensing page for full details.
For more information, visit our FastReport .NET Ultimate product page.
電話: (888) 850 9911
Fax: +1 770 250 6199


